Summary
I discovered that developers do leave remote JavaScript debuggers and headless browsers laying around on the internet leading to sensitive data exposure and an interesting remote position for an attacker.
The rest of the story
While learning how to actually use chrome devtools to remotely debug a Node.js application was working on I encountered an error when I tried to visit the debugger service with my web browser.
While the Node.js documentation says “exposing the debug port publicly is unsafe” and by default it listens on localhost my brain wanted to know the answer to this question; Do people just leave their debuggers hanging around on the internet
The answer is yes.
Because of the unique string that is output when making a basic HTTP request to the debugger service, we can use a service like shodan or zoomeye to find potential targets. On a penetration test this would be something very interesting to keep an eye out for internally.
https://www.shodan.io/search?query=WebSockets+request+was+expected
If you find one of these debuggers laying around not only do you get remote code execution, you also get source code, and secrets stored in the environment or the config. There is a lot of interesting and juicy information just laying around the Internet if you are willing to go look for it.
Let’s try it ourselves
-
Once you have found your target open chrome and browse to
chrome://inspect/ -
Click on the
Configure...button -
Put in the ip/hostname and port for the remote target and click
Done. Exampleevilpacket.net:9229
You should notice a new remote target appear in the list providing your the node.js version. -
Click
inspectto open up the devtools window and connect to the remote host. -
Click
Consolein the menu bar at the top. -
Now things get interesting and I’m not exactly sure why this happens (if somebody reading this knows please tell me), sometimes you get dropped into an alternative context (VM Context x). You will want to click the dropdown and select the
nodecontext. If you don’t when you try and run some code you might end up with something like
Uncaught ReferenceError: process is not defined
    at <anonymous>:1:1
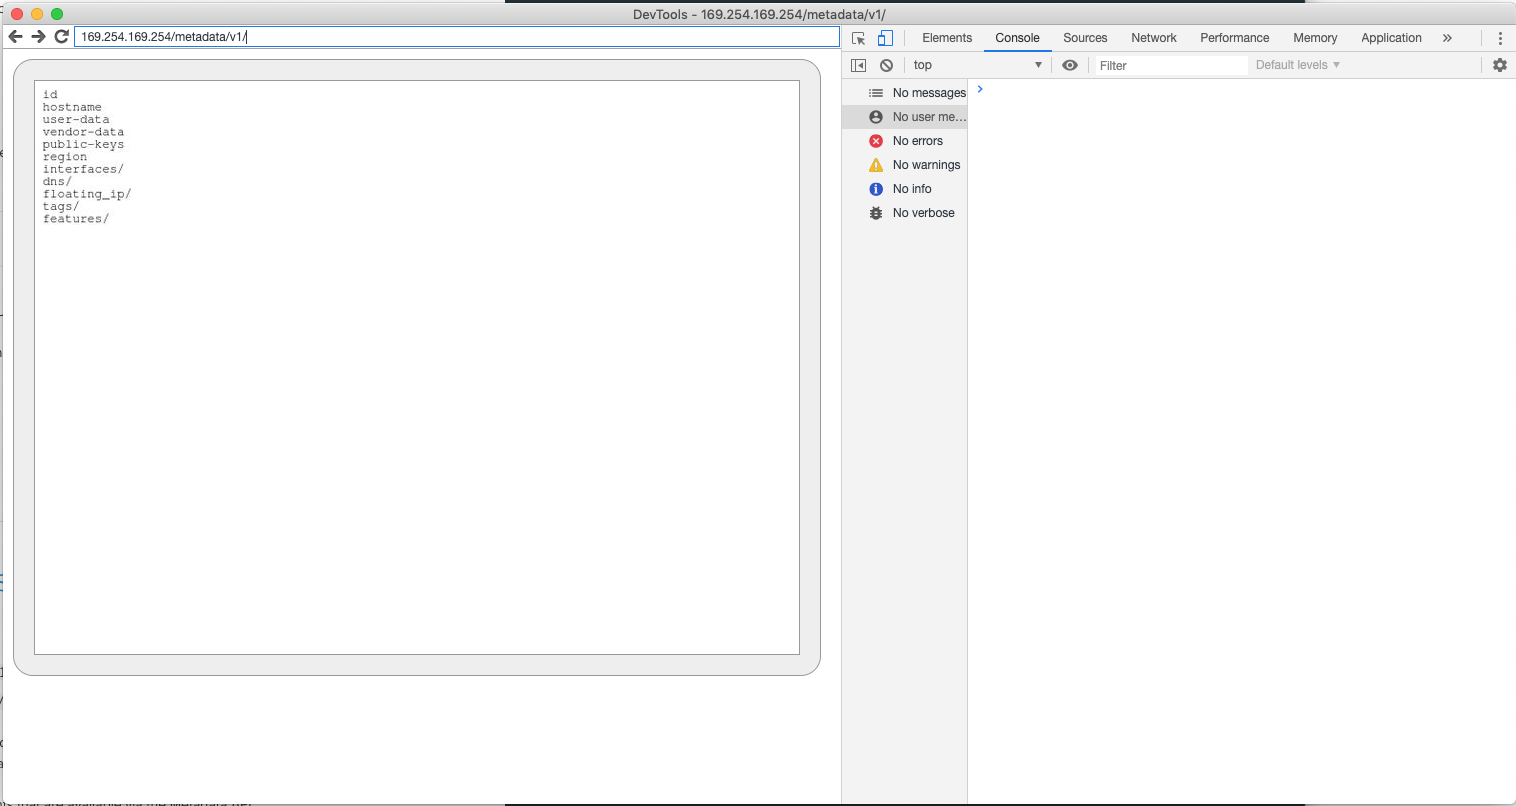
At this point you are free to run and execute code as you wish with whatever permissions the user has at whatever location this host is in the remote network.
But wait, there’s more.
More than just Node.js developers utilize Chrome dev tools. In fact a lot of developers use headless browsers for all kinds of testing.
Aninteresting search to do to find these open resources is Inspectable WebContents.
When you connect to one of these instances you basically get a browser inside a browser so you can access any active cookies or client side sensitive data that may be cached. Additionally you get to have a browser at that servers position in the newtork that may be able to access interesting internal services or metadata urls as pictured below.