Last night I tossed up a quick CTF-esque challenge with a couple of flags defined.
Let's have some fun with a CTF challenge. I'll post updates & solves here or something.
— Adam Baldwin (@adam_baldwin) November 27, 2020
IP:PORT 178.128.7.71:9222
flag1: /home/browser/flag.txt
???
flag2: /root/flag.txt
It's one service on one box, don't be dicks to the service provider / others or my account or it won't be fun
The host and service to attack is located at 178.128.7.71:9222 and will be online until it’s rooted or I get tired of watching it. Spoilers ahead.
Discovery
If you visit this in a browser you’ll see “Inspectable WebContents”, in older versions or maybe this is because it’s Chromium vs Chrome idk, you used to see “WebSockets requests was expected”
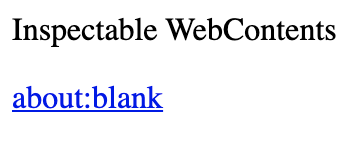
Depending on how you went about discovery you should arrive at the conclusion that it’s a remote headless debugger.
If you want to run this locally and play around you can do something like the following.
/Applications/Google\ Chrome.app/Contents/MacOS/Google\ Chrome --remote-debugging-port=9222 --remote-debugging-address=127.0.0.1 --headless
Getting the flag
There are a few ways we can interact with this. I prefer to setup the debugger as a remote.
- Navigate to
chrome://inspect - Click ‘Configure…’
- Enter in the host:port of the remote debugger - 178.128.7.71:9222
- Click ‘Done’
You should then see something like this.
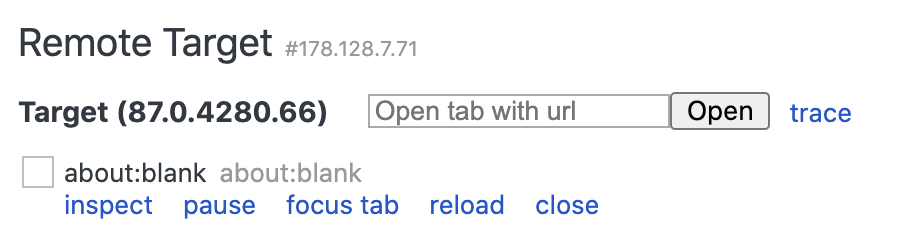
The important piece here is for the first flag is ‘Open tab with url’ -
If we step back and think about what we have in front of us is just a web browser that’s running on a remote host. We can tell it to go to any url that we want and it will do that, type evilpacket.net and you’re surfing evilpacket.net (lol surfing the web) but there are more than just http and https:// url schemas. The file:// schema will let us read from a local file, remember to keep your perspective as operating from the remote host, so we’re reading files that the remote process can read.
If you just click on the about:blank url and try and navigate to file:////home/browser/flag.txt it won’t work because the : gets stripped. Using window.location='file:////home/browser/flag.txt' Might give an error Not allowed to load local resource:
But if we use the ‘Open tab with url’ box mentioned above you can open a tab to that location and read the contents. Ooh and the contents might not be visible to you in the page on the debugger you might have to dig through the elements.
A few handy tips
http://178.128.7.71:9222/json will show you all the tabs and their debugger endpoints. Sometimes when you find debuggers in the wild this blob will have internal IP addresses, just re-write them.
If you don’t have the Open tab with url inputbox, you can use http://178.128.7.71:9222/json/new?file:////home/browser/flag.txt to create a tab to be able to inspect.
Interesting data
The first 3 people to bring me the flag were
- @jstash
- @cnelson
- @JF0LKINS
- @substack
Here is a list of the urls that various people have tried so far.
ok. I think that should leave everyone on the same page for part 2. Hints to follow on twitter.